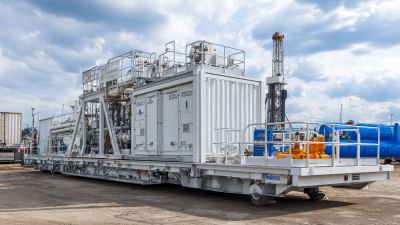
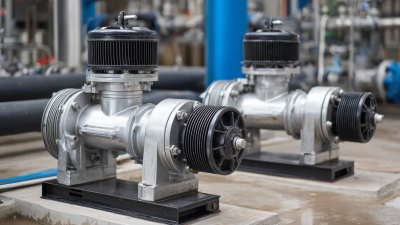
7 Tips for Choosing the Right Frac Pump?
Choosing the right frac pump is not simply a matter of selecting the highest horsepower. A reliable decision connects pressure, flow rate, duty cycle, well design, maintenance access, and total operating cost. The U.S. Energy Information Administration’s Drilling Productivity Report shows how strongly shale activity changes across major basins. That variation matters. A frac pump suited to the Permian may perform differently in the Bakken, where temperatures, logistics, and service schedules can differ sharply.
Industry forecasts also support a careful approach. The International Energy Agency’s Oil 2024 report identifies continuing investment in North American tight oil, while its medium-term outlook highlights uncertainty in demand, production, and project economics. Operators therefore need equipment that performs today and remains practical under changing utilization. SPE technical papers on hydraulic fracturing repeatedly emphasize horsepower management, fluid efficiency, pressure control, and equipment reliability. These are not brochure features. They affect every stage of a treatment.
This guide presents seven practical tips for choosing the right frac pump. It examines hydraulic requirements, pump configuration, power source, fluid compatibility, monitoring systems, maintenance support, and lifecycle value. A pump can meet its rated pressure and still be the wrong purchase. That is an uncomfortable lesson.
Field conditions are rarely clean. Sand settles, seals wear, weather changes, and delivery delays happen. Procurement teams should compare verified performance data, service records, emissions information, and manufacturer support. Reported figures can also vary by basin and operating method, so independent validation remains essential. The best frac pump is not always the newest or largest model. It is the one that delivers safe, consistent, and economical performance under the actual job conditions.
Define Frac Pump Requirements: 10,000–15,000 psi and 60–100 bpm
Choosing the right frac pump begins with a clear operating window. Define whether the job requires 10,000, 12,500, or 15,000 psi. Also confirm the target rate, such as 60–100 barrels per minute. These numbers should reflect actual treatment stages, not optimistic estimates.
A pump rated for 15,000 psi may not deliver 100 bpm continuously. Check the pressure-rate curve, duty cycle, and allowable fluid temperature. At 10,000 psi and 60 bpm, hydraulic power is about 350 horsepower. At 15,000 psi and 100 bpm, the requirement approaches 875 horsepower before efficiency losses. Engine input will be higher. Substantially higher.
Field experience shows that pressure spikes often cause more trouble than steady pressure. Review pulsation dampeners, valves, fluid ends, and discharge manifolds carefully. Abrasive fluids can accelerate wear, while changing viscosity may affect suction performance. Monitoring should capture pressure, rate, vibration, and temperature in real time. A reliable control system can reveal declining performance before a failure becomes expensive.
Do not size the pump around one perfect calculation. Leave practical margin for elevation, friction, imperfect maintenance, and changing formation response. I have seen clean spreadsheets hide weak assumptions. That is worth questioning. A smaller pump may reduce fuel use, yet it can struggle during high-rate stages. A larger unit offers capacity, but unused power adds cost and complexity. Confirm the manufacturer’s test data, maintenance intervals, and service support before approving the final configuration.
Match Hydraulic Horsepower: Compare 2,000–3,000 HHP Pump Packages
Choosing a frac pump starts with matching hydraulic horsepower to the planned treatment, not just selecting the largest package. A 2,000 HHP pump may suit moderate rates and shorter stages. A 3,000 HHP package offers more operating headroom, but it can increase fuel use, cooling demand, and maintenance pressure.
Compare flow and pressure at the same conditions. Hydraulic horsepower is commonly estimated with pressure multiplied by flow, then divided by 1,714.
A package delivering 80 bpm at 10,000 psi produces about 467 hydraulic horsepower, so the engine rating includes substantial mechanical overhead.
Field experience shows that nameplate power can mislead. Review the pump curve, maximum continuous pressure, stroke rate, fluid temperature, and expected duty cycle. Ask how the unit performs during repeated pressure changes, not only during a short test. Check the power end, fluid end, valves, liners, pulsation control, and spare-part access. Small details matter beside a dusty well pad. They affect uptime.
A 2,000 HHP system may be efficient when the design stays comfortably below its limits. A 3,000 HHP system may provide useful reserve for higher rates or formation changes. However, reserve is not free. It needs stronger supporting equipment, adequate cooling, and operators who understand the controls. I have seen teams compare horsepower while overlooking suction conditions and manifold restrictions. That mistake can reduce real output. Use verified field data, maintenance records, and independent calculations before approving the package. Recheck every assumption.
Assess Reliability: Require API 7K Compliance and N+1 Pump Redundancy
A frac pump should be judged by controlled reliability, not impressive horsepower.
Require documented compliance with applicable API 7K requirements, including design review, pressure testing, guarding, and traceable inspection records. Confirm the certificate covers the exact pump configuration, not merely a similar model.
N+1
redundancy is equally important. If six pumps deliver the planned rate, specify seven available units. This provides 16.7% installed redundancy before considering maintenance losses. The extra pump should remain connected, tested, and ready for immediate load transfer. A spare parked far from the manifold is not true redundancy. It is only insurance on paper.
IOGP’s 2023 safety performance data reported 31 fatalities among participating oil and gas companies, reinforcing the cost of weak operational controls. Reliability teams should also record failure modes using ISO 14224 terminology, then review seal leaks, valve damage, vibration, and unplanned shutdowns after every stage. Pressure data can reveal a failing pump before the crew notices noise or heat. I may be overly cautious, but certificates alone do not prove field reliability. Review maintenance history, test intervals, and technician training. Ask for evidence. Challenge optimistic uptime claims. A pump can meet a standard and still perform poorly when dust, heat, sand, and rushed maintenance arrive together.
Compare Lifecycle Costs Using Fuel, Uptime, and Maintenance Data
7 Tips for Choosing the Right Frac Pump?
Compare lifecycle costs, not purchase prices. A lower-cost pump can consume more fuel during every pumping stage. Record fuel use per completed stage, operating pressure, flow rate, and idle hours. The U.S. Energy Information Administration’s Short-Term Energy Outlook provides regional diesel price data for consistent cost modeling. Use those prices, not a supplier’s optimistic estimate.
Uptime deserves equal attention. Track planned hours, unplanned stops, restart time, and lost pumping hours. A five-hour repair during a narrow weather window can cost more than several months of fuel savings. The U.S. Department of Energy’s Operations and Maintenance Best Practices Guide reports that preventive maintenance can reduce maintenance costs by 12–18%, while predictive maintenance may deliver larger savings when monitoring is reliable. The exact result varies.
Measure the details.
Maintenance records should include valve changes, fluid-end inspections, technician hours, spare-part costs, and disposal expenses. ISO 14224 offers a useful structure for collecting equipment reliability data across sites. Compare pumps over the same duty cycle and pressure range. Otherwise, the spreadsheet may reward the wrong machine.
I have seen teams compare hourly fuel burn but ignore warm-up time and standby consumption. That is a real weakness. Include transport, installation, emissions controls, training, and major overhaul intervals. Review at least twelve months of field data before making a final selection. Better records usually reveal the expensive pattern first.
7 Tips for Choosing the Right Frac Pump? — Compare Lifecycle Costs Using Fuel, Uptime, and Maintenance Data
Representative planning comparison for one 2,500-hp-class pump operating 4,000 hours per year at approximately 70% average load.
| Selection Tip |
Data Dimension |
Mechanical Diesel Pump |
Electric-Drive Pump |
1. Match pressure and flow requirements
| Typical operating envelope |
2,500 hp; approximately 80–100 bpm at 10,000 psi, depending on fluid properties and pump efficiency.
|
2,500 hp equivalent; approximately 80–100 bpm at 10,000 psi when sufficient grid or onsite generation capacity is available.
|
2,500 hp; approximately 80–100 bpm at 10,000 psi, with output affected by ambient temperature and altitude.
|
| 2. Compare fuel or energy efficiency |
Primary energy consumption |
Approximately 65–95 gal/h of diesel at 70% average load.
Planning midpoint: 80 gal/h
|
Approximately 1.3–1.5 MW of electrical demand at 70% average load.
No onsite combustion fuel
|
Approximately 85–120 Mcf/h of natural gas at 70% average load.
Planning midpoint: 100 Mcf/h
|
| 3. Measure expected uptime |
Operational availability target |
90–95% with scheduled inspections, clean fuel, and properly managed cooling systems.
|
95–98% when power quality, cooling, and variable-frequency-drive support systems are controlled.
|
88–94%, with additional sensitivity to gas pressure, gas quality, and ignition-system condition.
|
| 4. Quantify downtime exposure |
Unplanned downtime allowance |
Approximately 200–400 hours per year.
Higher risk during intensive duty cycles
|
Approximately 80–200 hours per year.
Fewer rotating engine components
|
Approximately 240–480 hours per year.
Gas supply interruptions can extend outages
|
| 5. Include scheduled maintenance |
Routine maintenance burden |
Oil and filter service generally every 250–500 operating hours; injector, turbocharger, and cooling-system inspections are also required.
|
Motor and drive inspections generally follow condition-based or annual schedules; cooling and electrical-system maintenance remain necessary.
|
Oil and filter service generally every 250–500 operating hours; spark plugs, ignition components, gas valves, and exhaust systems require attention.
|
| 6. Calculate annual operating cost |
Illustrative annual energy cost |
About $1.20 million at 80 gal/h, 4,000 h/year, and $3.75/gal diesel.
|
About $504,000 at 1.4 MW, 4,000 h/year, and $0.09/kWh electricity.
|
About $360,000 at 100 Mcf/h, 4,000 h/year, and $0.90/Mcf natural gas.
|
| 7. Compare total lifecycle cost |
Three-year cost framework |
Energy: $3.60M
Maintenance allowance: $0.45M
Downtime exposure: $0.30M
Estimated operating total: $4.35M
|
Energy: $1.51M
Maintenance allowance: $0.27M
Downtime exposure: $0.15M
Estimated operating total: $1.93M
|
Energy: $1.08M
Maintenance allowance: $0.54M
Downtime exposure: $0.36M
Estimated operating total: $1.98M
|
Planning assumptions: Values are representative engineering estimates for comparison rather than quotations. Actual results vary with pump efficiency, pressure, fluid density, operating profile, ambient conditions, fuel quality, electricity tariff, gas pricing, maintenance practices, and the cost of a lost pumping hour. Lifecycle calculations exclude purchase price, installation, taxes, financing, and site-specific infrastructure.